
Evaluating AI models after training
Congratulations, you have trained and tested your machine learning / deep learning model. Now you need to understand if your model can be deployed for production. This article will summarize all approaches which will help you deploy your model successfully.
Whenever we find accuracy of a multi-class classification model we get four classification metrics:
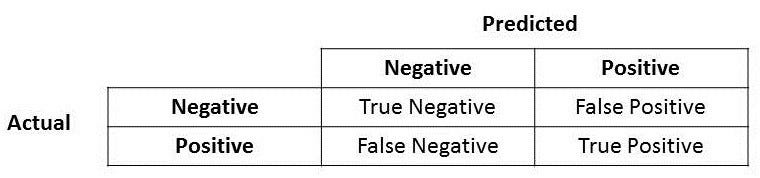
- True Positive: When you predict an observation belongs in a class and it does belong in the class.
- True Negative: When you predict an observation does not belong in a class and it does not belong in the class.
- False Positive: When you predict an observation belongs in a class but it does not belong in the class.
- False Negative: when you predict observation does not belong in a class but it does belong in the class.
These four classification metrics are part of three evaluation metrics for a multi-class model.
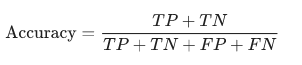
1. Accuracy:
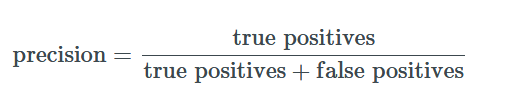
2. Precision
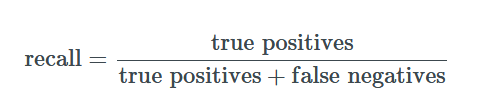
3. Recall
4. F1 score
What it all means?
For deployment and nature of the AI model we need to know what these evaluation metrics will tell us exactly.
For class- balanced data set , accuracy is a good metric. But whenever there is a class-imbalanced data set we need to consider precision, recall and F1 score.
Accuracy
Accuracy simply means the percentage of correct observations.
Example: Breast cancer detection model
Benign Tumors: True Negative+ False Positive
Malignant Tumors: True Positive + False Negative
True Positive: 1, True Negative: 89, False Positive: 1, False Negative: 7
(1 + 89) / (1 + 89 + 1 + 7) = 0.918
91.8% accuracy score for a breast cancer detection model means it is quite accurate but we need to look at the four classification metrics to make sense of the model.
Out of 90 benign tumors the model identifies 89 tumors as benign but 7 out of 8 malignant tumors go undiagnosed.
Thus our model is good at diagnosing benign tumors but terrible at predicting malignant tumors.
Precision and Recall
Precision tell us how many positive observations were actually correct.
Recall tells us how many positive observation were identified correctly.
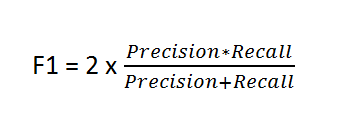
F1 score
In order to evaluate a model we need to look at both Precision and Recall. The problem with Precision and Recall is that if you improve Precision it deteriorates Recall and vice versa.
Thus, we have to look at the F1 score.
The F1 score is a weighted average of Precision and Recall metric. It is a score between [0,1] greater the value, better the model.
Bias vs Variance
The ultimate goal of every machine learning model is to make it as accurate as humanly possible. The problem in training models is that sometimes the model overfits, where it learns too good on training data and does not perform well on unseen data, if it underfits the accuracy is severely compromised.
Bias = training error
Variance = training error - dev error
Overfitting means: High bias and Low variance
Underfitting means: Low bias and High variance
Skewed model: High bias and High variance
Perfect model: Low bias and low variance (this should be the goal of our model).
How to fix a broken model
In order to fix bias: change model, increase epochs, use optimization fuctions, tune hyperparmeters
In order to fix variance: get more data, use regularization, tune hyperparmeters
Unfortunately, there are no fixed methods in improing accurancy of models, deep learning is an art not a science!
ROC Curve
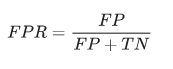
ROC curve (receiver operating characteristic curve) is a graph which shows the performance of a classification model at True Positive Rate and False Positive Rate.
True Positive Rate:
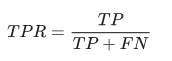
False Positive Rate:
ROC Curve Example:
The above example shows a typical ROC Curve but in order to compute different model many times over we need a sorting-based algorithm like the AUC.
AUC Curve
AUC simply means, area under the ROC curve. The x and y-axis is from 0 to 1.
AUC Curves provides a measure of aggregate performance for all possible ROC classification thresholds. There are two reasons we use an AUC Curve; it is scale invariant and classification threshold invariant. However, AUC Curve’s usefulness is marred by the fact that sometimes we need calibrated probability and in cases where there is wide disparities between false negatives vs. false positives. AUC has a range of [0, 1], greater the value, better the model.
Hopefully, this article can serve as a good primer in evaluating your AI model.